Airlines Insights – November volume declines continue amid pricing turbulence
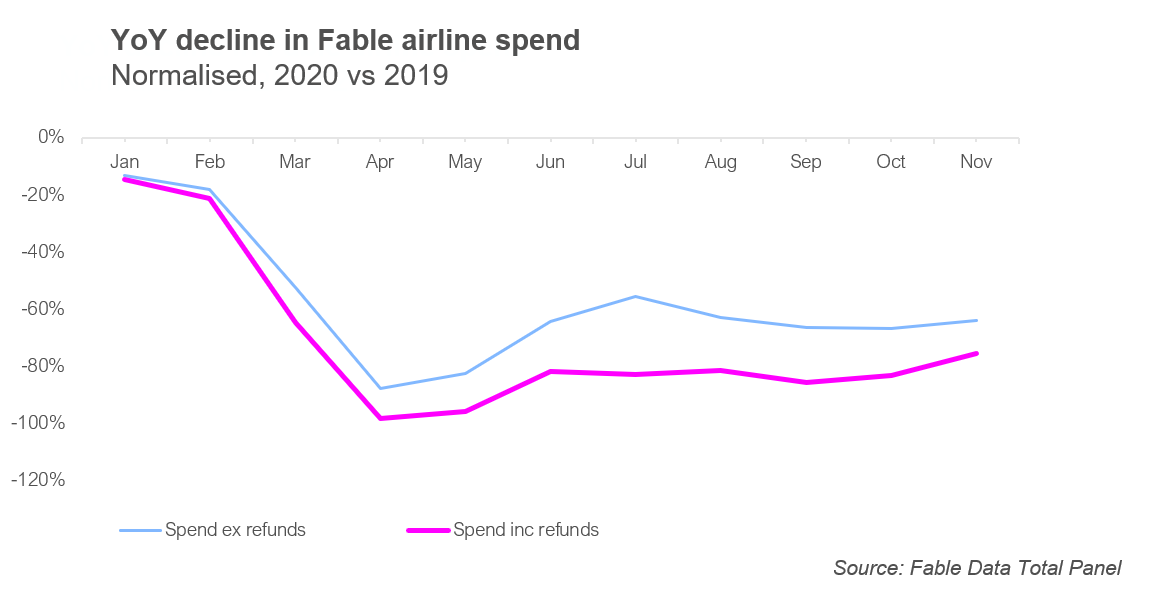
Fable Data can see consumer spending in real time, allowing us to track and quantify the seismic changes in the airline industry this year, looking for signs of where early recovery is happening by airline and region. By mapping account spending data to thousands of underlying merchants and stock tickers we can observe the performance of over 100 airlines. Specifically, we are tracking the slow recovery of airline bookings since the end of UK and Germany’s spring lockdown and through this year’s atypical peak season, which was negative impacted by global restrictions. Overall, spend across the airline sector showed a YoY decline on average of 63% excluding refunds and 82% including refunds, from June to November this year, and, as seen in the chart below.
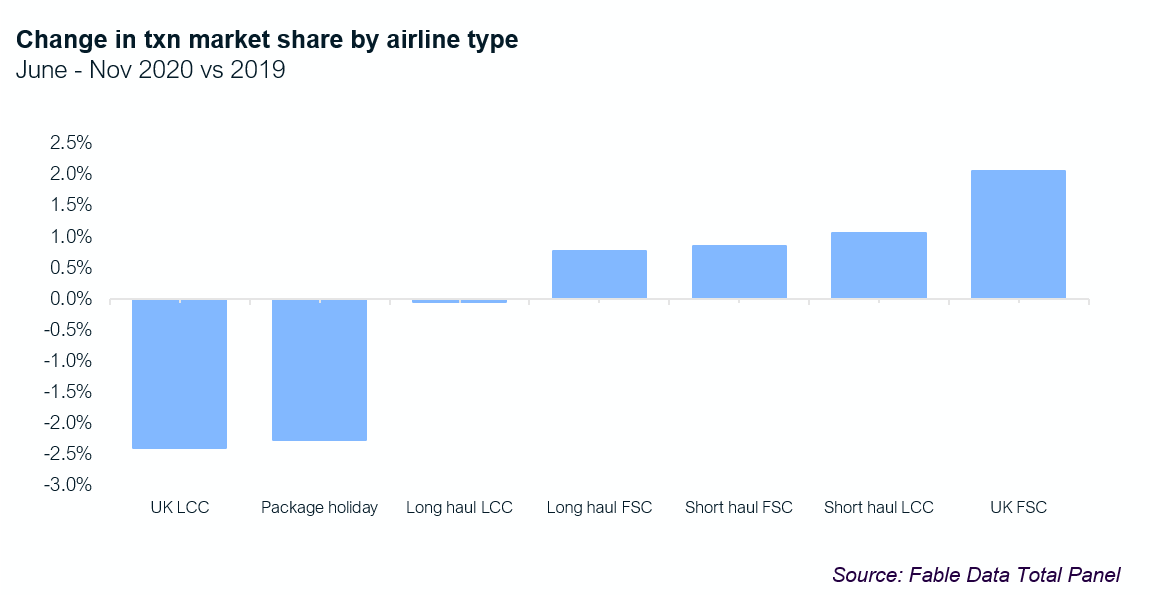
Which players have suffered most from volume declines?
The airline industry has been shaken up, due to unforeseen decline in volumes, the closure of players such as Thomas Cook and market share reallocation. This year given varying impacts on business travel vs leisure, long vs short haul and geographical variations in lockdown rules favouring some flight routes over others, we have seen the relative change in market share by airline type since June (analysis below). We have classed airlines by where they are based regionally – long haul (outside of Europe), short haul (mainland Europe) or UK based; and by cost profile (low cost versus full-service carrier). Thomas Cook is classed as ‘package holiday’, its closure has led to market increases from all full-service carriers, with UK based FSCs performing the best. Short haul low-cost carriers were able to increase share, driven by relative strong performance from names such as Wizz Air. UK based low-cost carriers lost the most share, perhaps due to relatively higher exposure to short haul business travel which has remained extremely weak and UK domestic travel all but grounding to a halt. Long haul FSC to regions with less restrictions have also gained share.
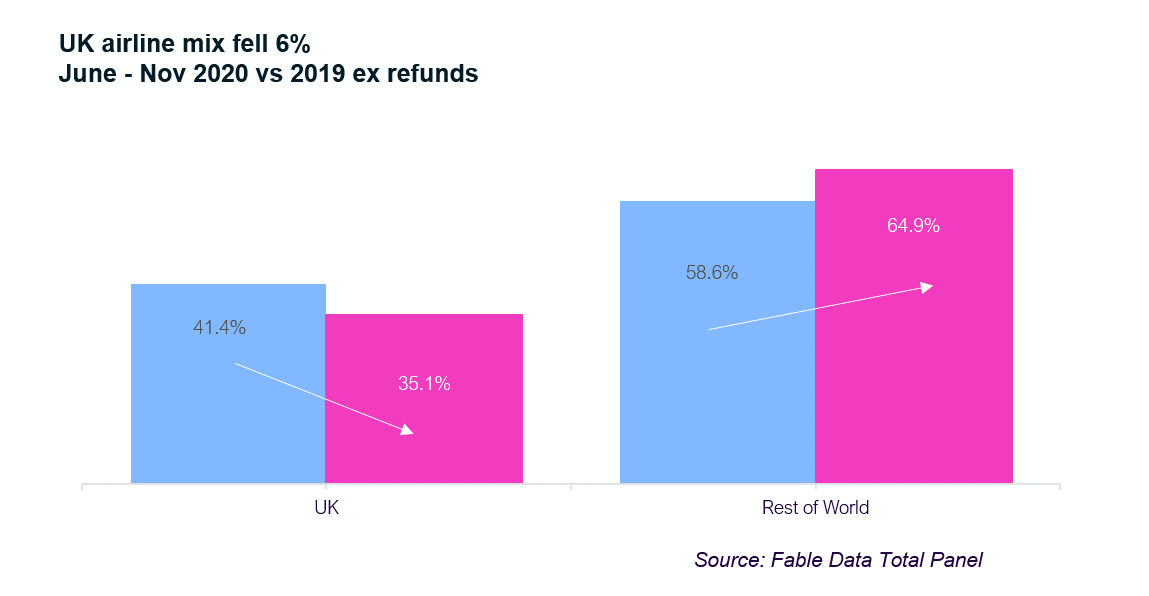
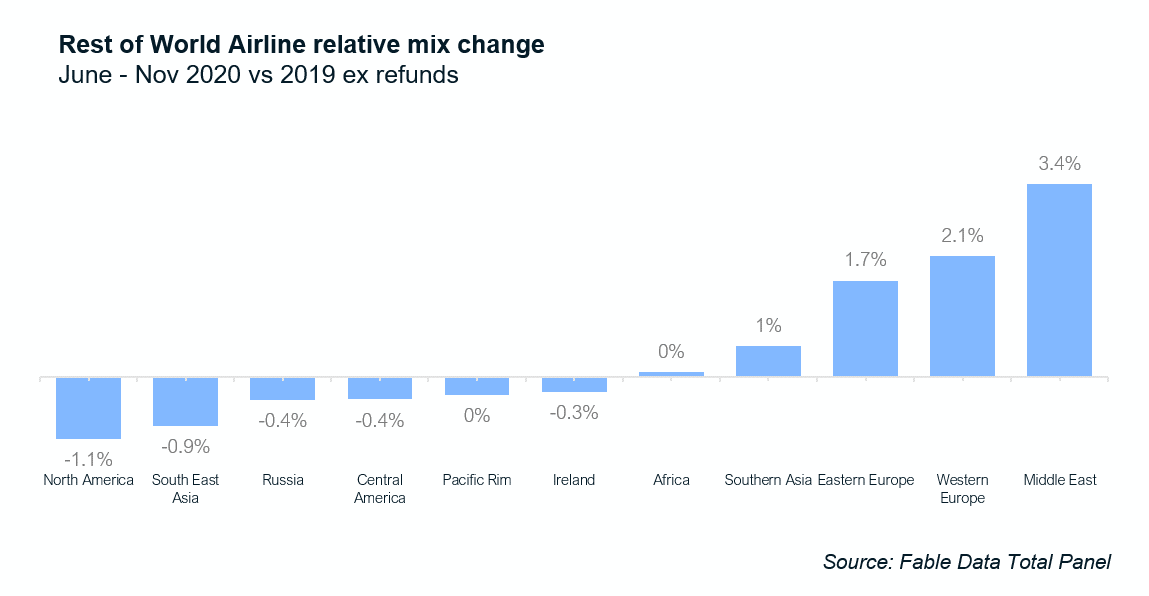
Regional variations influenced by global lockdown restrictions and pricing
The changes across the industry are clearly influenced by the national variations in lockdown restrictions and the regional easing of measures since the Spring. By analysing airline spend value by airline geographic base, we see Middle Eastern and mainland European based carriers have increased share, whereas UK have lost the most share of any category, based on bookings by UK and Germany based consumers and small businesses. For the UK based airlines, market share fell by 6 percentage points, largely driven by Thomas Cook and loss of long-haul holiday bookings, particularly from transatlantic routes.
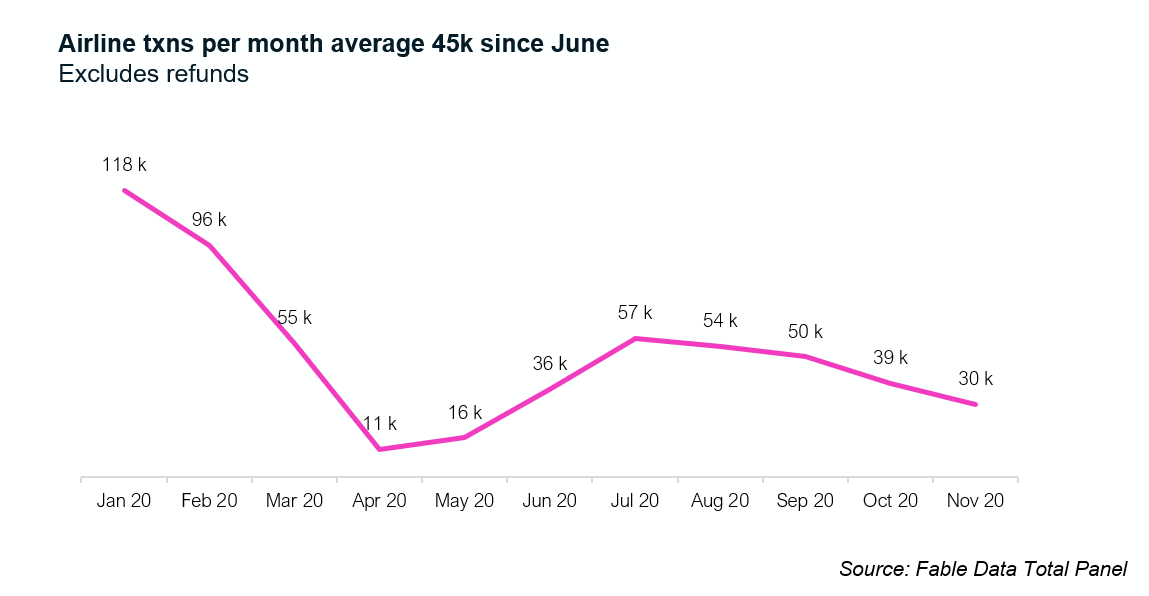
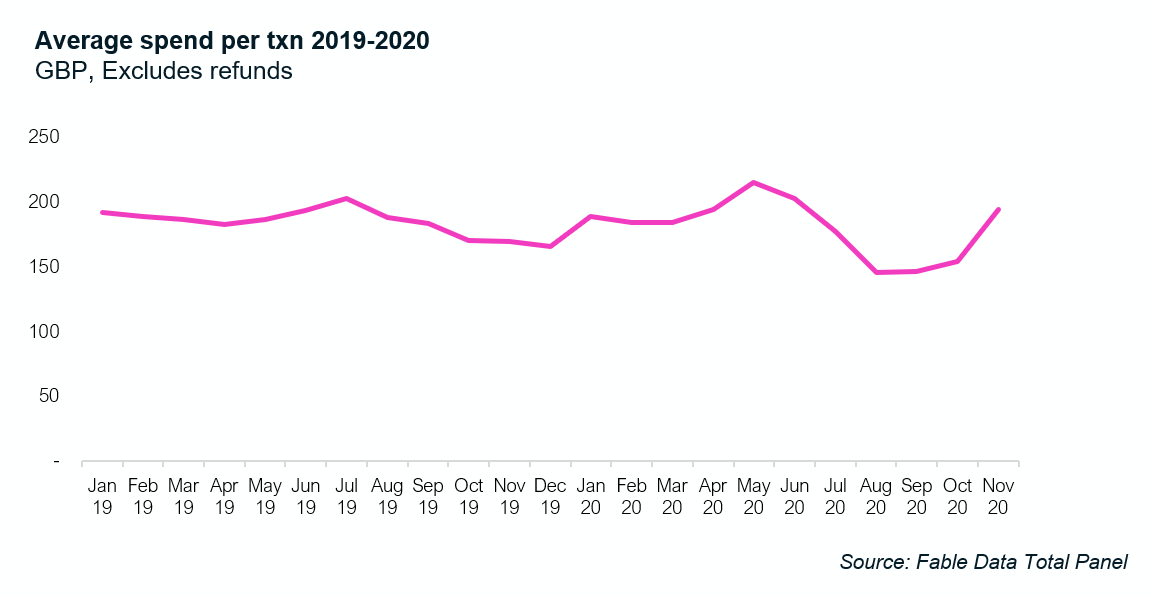
Despite the unprecedented conditions for the European airline industry, Fable Data is still seeing on average 45,00 airline transactions per month since June, albeit with significant price fluctuations, as shown in the charts below. The volume trough in April and May showed a recovery until July, and then gradually fell due to the end of the Summer holiday season, with the usual post Summer pick up in business travel absent this year. In recent months, the industry has been further impacted by further lockdown measures across Europe. That said, the second European lockdown appears to have had a reduced impact on airline volumes than the first. At the same time, average bookings value from June to October fell from £202 to £154, which likely reflects a combination of lower business travel mix, lower long vs short haul and aggressive discounting.
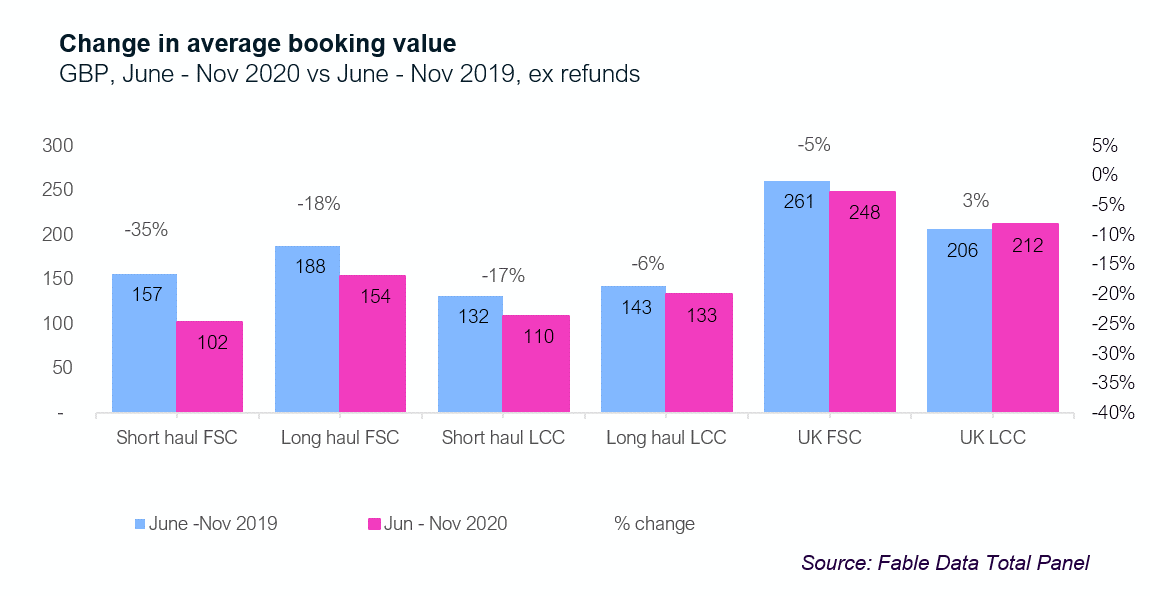
Short haul FSC have maintained average booking value, with losses seen elsewhere
The fluctuations in booking value this year have had a mixed impact on different classes of airline. The UK low-cost carrier group managed to maintain pricing, even showing 3% growth on average across June to November compared to 2019. Long haul low cost carriers fell 6%, but showed more resilience than short haul low cost carrier which fell 17%. Conversely, all other airline categories showed falling booking values on average, perhaps due to a double negative effect of flight route changes and discounting. Short haul full service carriers experienced the worst pricing change, with a YoY reduction on 35%, long haul fell 18% and UK based full service carriers (e.g. British Airways and Virgin) demonstrated only a 5% fall.
Early indication of price improvement in November, despite falling transaction volumes
Understandably there is margin pressure across the industry due to the combined impact of significantly lower ticket volume in conjunction with lower average ticket prices as discussed above. On the bright side our November data shows signs of recovery in pricing with average spend per transaction increasing to £194. Volumes remain in decline however; we saw a 23% drop month on month from October to November, perhaps due to the impact of new lockdowns. With the positive news about COVID-19 vaccines, we will continue to look for the early signs in our data of increased confidence and recovery.
At Fable, our data science team helps investors and global corporates to analyse our category data at the individual stock ticker level. For more detail on the company specific data behind these trends, please contact Stephanie@fabledata.com