In uncertain times the most reliable source of information is consumer spend. While Investor Relations teams endeavour to advise shareholders about any business impacts they are enduring, management focus is always on first navigating the choppy waters. This often leads to delayed information and drastic stock price moves. It is no surprise, given the Covid 19 pandemic, that airlines, groceries and the travel sector are feeling shockwaves, as fear and travel bans kick in. What is surprising, however, is the latency in the stock price reaction. Typically an investor, who is also a consumer, is changing their habits in real time but making trading decisions with a delay. This is understandable as any individual investor is sample of one, not representative of the broader population. But, zoom out to a large enough population and the trend is revealing.
Fable Data has daily spend coverage at over 15 airlines, ranging from Ryan Air to Turkish Airlines and Lufthansa. This covers a cross-section of business and individual travellers. The Fable Airlines Index began to show a large decline in spend well in advance of the market, showing a correction of 10% before stabilising on February 1st 2020. In the subsequent two week period, the S&P Airline index remained almost 8% higher than Fable’s index, before eventually plunging on 24 February. At this same point, the Fable index the fell another 40% while the S&P Airline index showed only gradual downwards movement, before lurching lower again over the past few days.
Clearly passenger spend has not been the only thing driving the decline of stock prices but it is certainly a good leading indicator, as it will be when there is a fundamental turn to the upside.
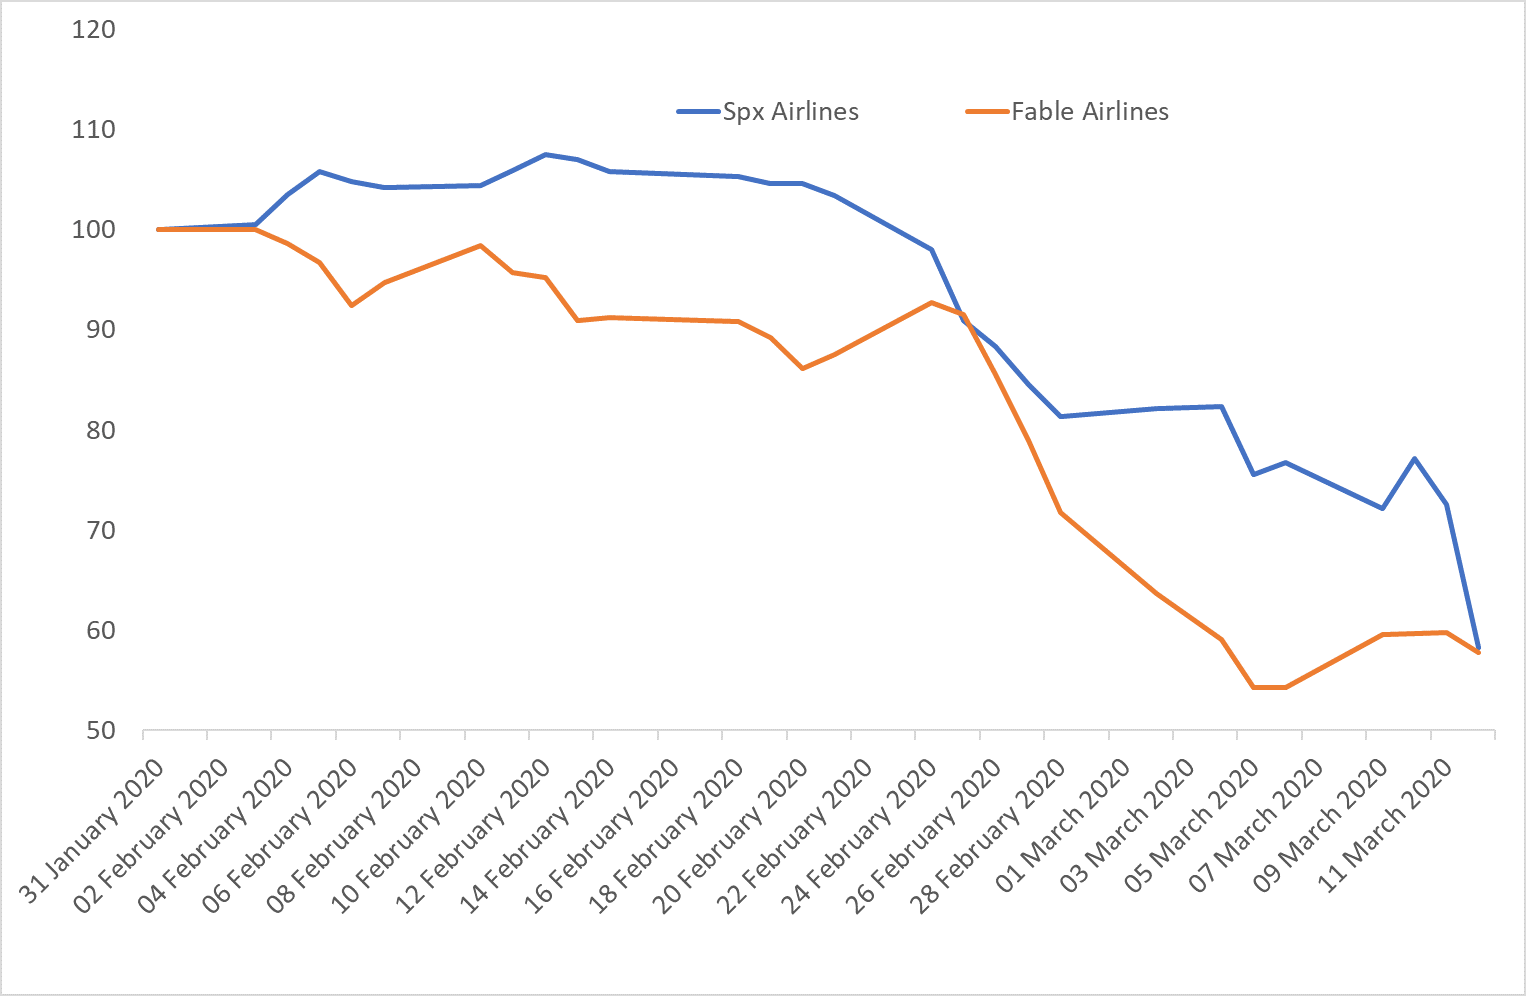
Airline Sector – S&P Airline Index vs Spend in Airlines
Fable Data has the best leading indicator of the performance of the travel sector. Access to our panel can provide competitive advantage versus the market, with clear signals from consumer behaviour fore-running market moves by a matter of days.
As Covid 19 has spread, awareness and fear have prompted a shift in consumption patterns from individuals through to employers and governments. In the news we have seen supermarket shelves emptied of toilet roll and pasta, demand for online grocery deliveries spiking and travel disruption. But what is the market-wide magnitude of these reactive behaviours, and how great an impact on business have they actually made?
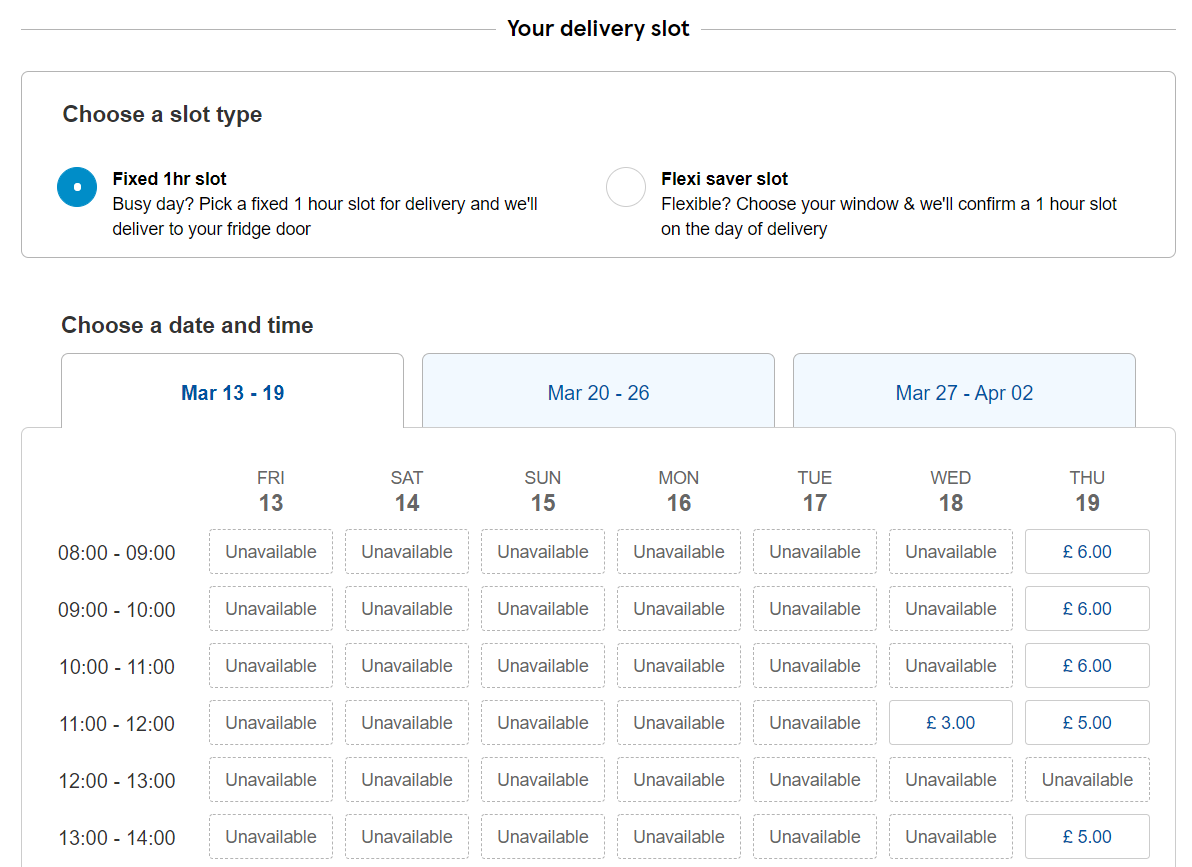
Tesco delivery slots are full
We’ve investigated this question using the Fable Data panel of anonymised consumers spend by trending 2019 revenue versus 2020. Our hard sales data shows there has been a jump in consumer demand in both supermarkets and online groceries. Year on year sales are up by nearly 5% for the last week as UK consumers rush to stockpile, clearing out soap, toilet roll and hand sanitiser. To investigate this jump further, we took the busiest day of the week for grocers – Saturday – and compared the average basket value from last Saturday with the same day in 2019, and saw the same average basket size, as well as a similar overall value distribution. Meaning a rise in number of transactions drove the jump in revenue, rather than bigger baskets.
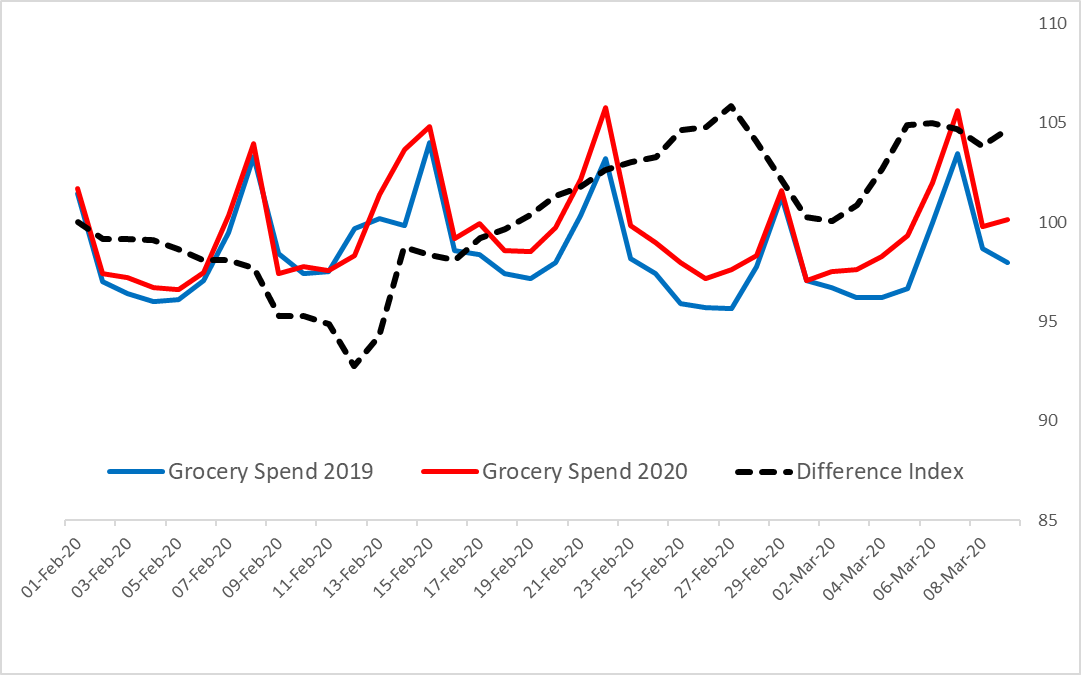
UK Grocery spend trend 2019 vs 2020
We’ve also looked at sales trends for bars and restaurants in the UK and cannot yet see a fall. However, public attitude towards socialising may be turning and with many sports fixtures now cancelled or postponed there are fewer reasons to go to a pub.
Are you interested in how our trends breaks down on an airline by airline or grocer by grocer basis? Would this data be invaluable to your investing decisions? We can answer these and many other questions related to the consumer economy in Europe.