“Transactional data is the Mount Everest of the alternative data world” Can it be climbed?

This year the dislocation of consumer spending due to Covid-19 has presented numerous technical challenges for users of transactional data. As consumer behaviour changed radically, this triggered a huge increase in interest from investment companies in Fable’s real time spending data in order to monitor economic trends.
We saw that cash spending declined by a third whilst the mix of card spending rose significantly – particularly for contactless payments. Our real time spending data monitored the decline in bricks and mortar stores whilst e-commerce boomed. Despite our database increasing in size due to these effects, the use of transactional data has not been plain sailing as new technical challenges have emerged. In normal times a continuous panel is a reliable way to model revenue. Now we’re having to find novel ways to create dynamic panels to ensure we continue to get a good signal from a larger universe of data, with constantly shifting and somewhat unpredictable patterns of behaviour in card payments.
Transactional data can be a key indicator of macro-economic trends
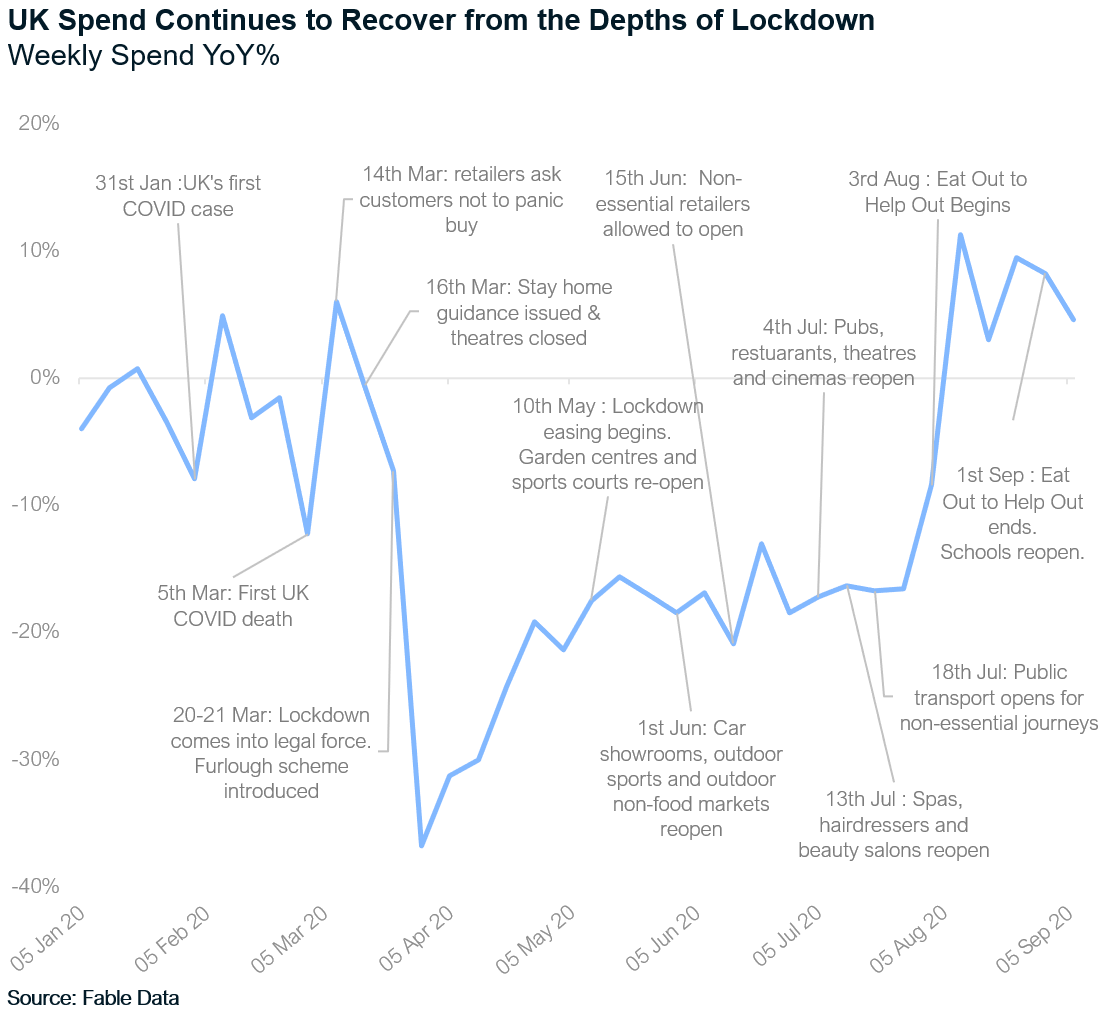
In March we launched a free weekly report to track the consumer economy in the UK and Germany. We found the data to be a useful way of tracking patterns in total consumer spend and measuring the consequent impact on consumer behaviour, whilst we lived through the unfamiliarity of lockdowns and subsequent government interventions.
In the UK, initially we saw a rise in spend due to consolidation of purchases ahead of lockdown, followed by an extreme drop, then progressive easing as sectors gradually opened up. Recently YoY growth has returned in some areas, spurred on by new government initiatives.
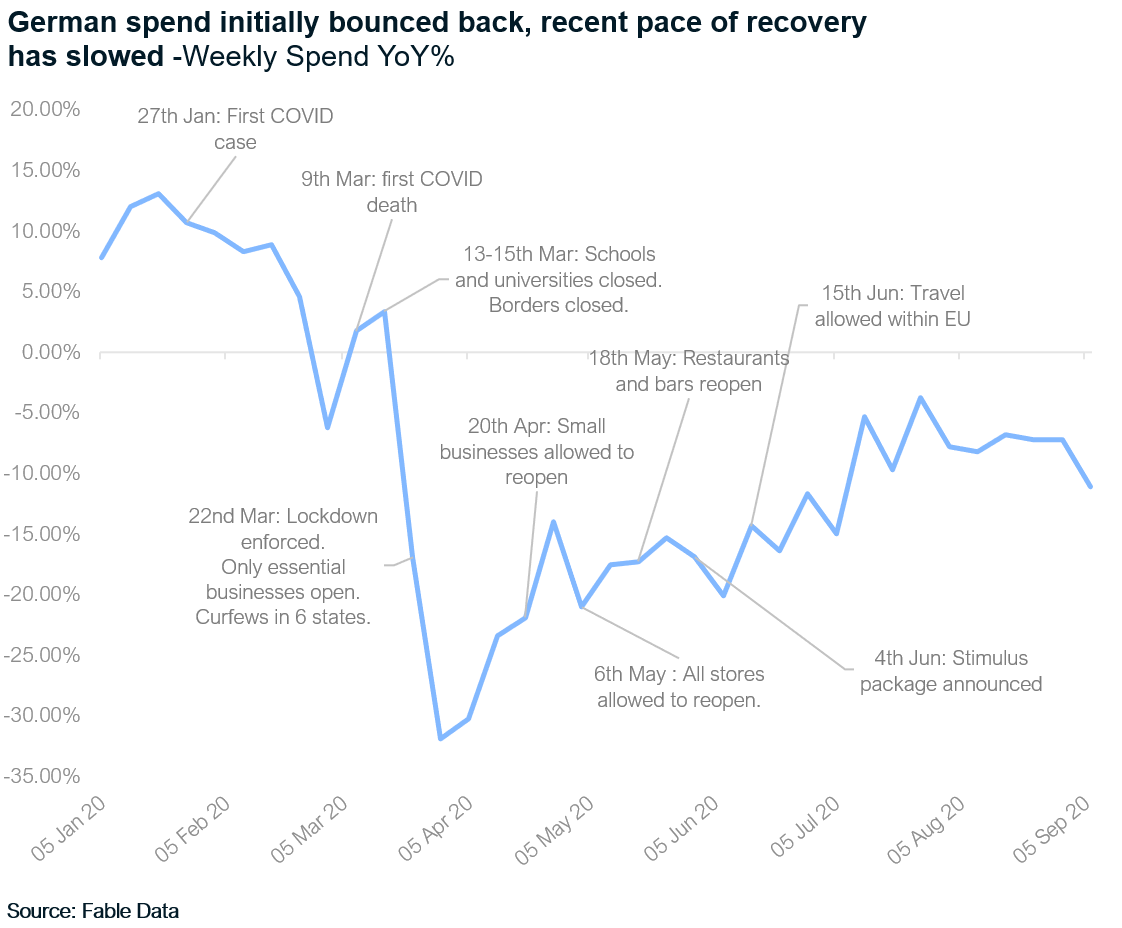
We observed a similar trend in Germany, albeit with a less severe trough and quicker recovery, following a more decentralised approach on lockdowns and less burdensome measures overall.
Creating consistent consumer cohorts works well for sectors with high and consistent spend
These trends were confirmed by lagging indicators such as company reported sales and ONS data releases. To verify the accuracy of the data presented above we created bespoke spending panels by industry and by merchant, and found correlations between our data and official reported results of >90%.
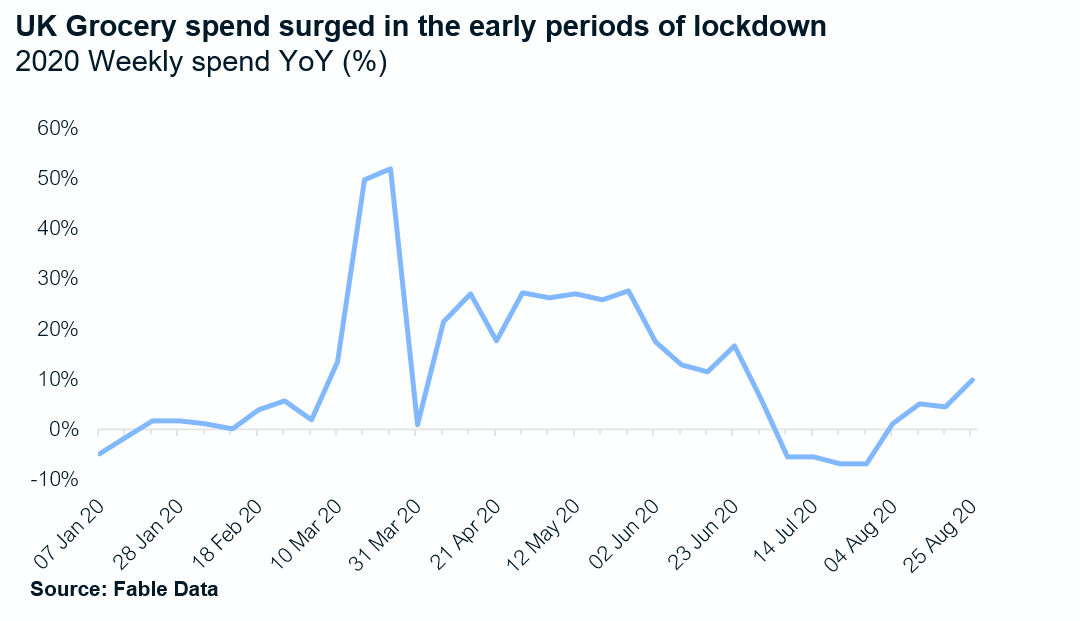
The concept of a rolling panel works well for many stock tickers such as grocers – this technique involves the dynamic selection of consistent cohorts of consumers between periods. Within this category back in April, we saw distinct changes in behaviour such as the doubling of baskets with fewer transactions, which lead to a 20% increase in YoY spend. This new behaviour of fewer, bigger baskets has since continued. In addition, our data allowed us to identify certain winners in the grocery category, including independent corner shops, large supermarkets, and online grocers, whereas small format city centre stores lost share.
All-inclusive panels, or panels defined by common characteristics, are more effective in other sectors
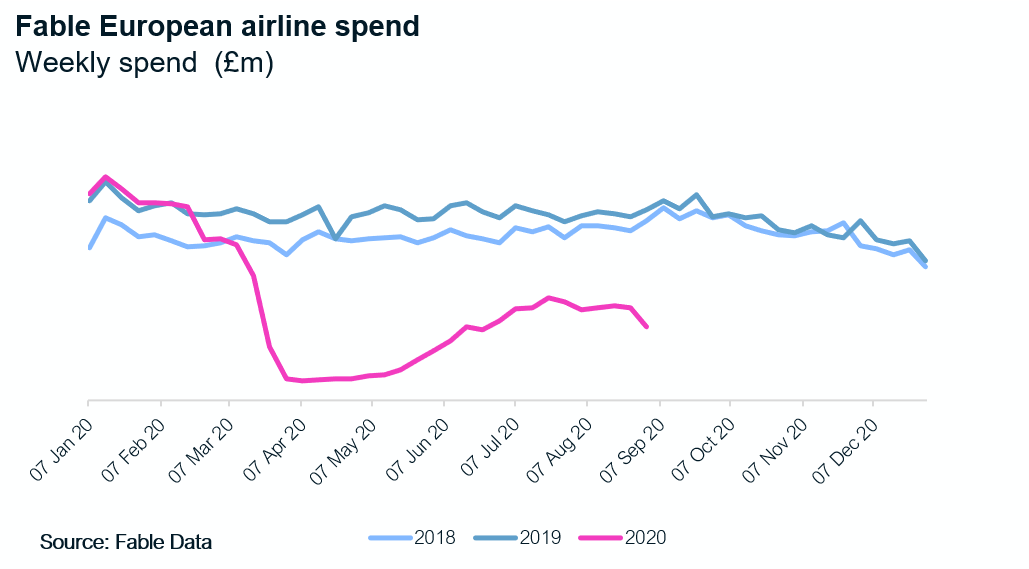
On the other hand, using all available data to track companies such as airlines, where ticket purchases are not part of a regular spend, has proven to be more effective. By capturing all data that is available in our database, we include infrequent shoppers and some panel variability over time as our data partners organically grow. We normalise for this when we calculate company level trends. Constructing a panel defined by common characteristics of a particular consumer set (e.g. age, location or socio-demographic status) can also work well for certain retailers.
In an uncertain landscape, it’s our scale, agility and tailored approach that will allow us to summit the mountain
Despite ever changing trends in consumer behaviour, the scale of relevant spend by users in our database allows us to find signals on the companies we cover. Pressure on consumer spending can be a double-edged sword for credit card data sets. Some consumers will spend more in a recessionary environment as their ability to afford every day purchases decreases and their need for short term debt increases. Others will spend less if their card is used more occasionally to collect rewards for irregular large purchases, for example. Whilst we win on some and lose on others, this can lead to a grey area for transactional data users, and it’s a topic we discuss regularly with our clients. We mitigate against this using bespoke methodologies alongside our scale, resulting in verification that our panels corroborate with the official releases from the ONS and company reported revenues.
At Fable, our data science team helps investors to optimise the signals in our data and generate alpha. We supply real time multi-sourced credit card and debit card data from millions of rows of tagged anonymised transactions, to investment companies, corporates, and governments.
For more information, contact stephanie@fabledata.com